Recession? What recession? As 2023 kicked off, the overwhelming majority of Chief Economists on Wall Street were calling for the U.S. economy to dip into recession at some point during the year. According to the sixty professional forecasters polled by the Wall Street Journal at the start of the year, the median probability that U.S. economic growth would roll over into negative territory at some point during the year stood at 65%.1 Around the same time, the annual Bloomberg survey of 25 of Wall Street’s top investment strategists found that the group’s average year-end target for the S&P 500 was below the starting value on January 1st for the first time in the history of the survey.2 The message from Wall Street’s top minds was clear – the pain felt in 2022 was likely just getting started. The stock market doesn’t bend to the will of the supposed smartest guys and gals in the room, however. Markets reflect the collective psychology of crowds. And the equity market has sent a clear and humbling message to all the perspicacious prognosticators over the first six months of the year. Simply put, the market has told the experts they are glaringly wrong. Just how wrong did the crowd think the wizards of Wall Street were? The S&P 500 started 2023 by posting the second strongest return over the first six months of the year this century. This year’s first half is the twelfth strongest since 1925 – a very welcome development for investors after one of the worst years on record for markets in 2022. Will this year notch another victory for the collective wisdom of the crowd? Or are we actually in the midst of another common phenomenon to which human behavior is subject – the madness of crowds? Below are some of the factors we will be monitoring in the months ahead that will likely determine who is correct, the experts or the crowd.
While the Federal Reserve has continued to make progress in the battle to get inflation under control, policy makers still have work to do in the back half of the year. Despite the first pause in rate hikes since this tightening cycle began in June, members have made it clear in their public comments that more hikes are going to be needed. This means financial conditions will continue to tighten against the backdrop of an earnings slowdown (and for some industries an outright earnings recession). The market has largely been driven year-to-date by a few of the largest companies, which have the heaviest weights in market-cap weighted indices. The “Magnificent Seven” includes NVIDIA, Meta, Amazon, Microsoft, Apple, Alphabet, and Tesla – the inclusion of Netflix, which has also soared this year amid a crackdown on password sharing, would make it the “Elite Eight”. Collectively, these firms have an average P/E ratio of 39.3, a record premium over the rest of the stocks in the S&P 500. But P/E ratios have quietly increased across the board this year as the denominator in the equation has stagnated or fallen across many industries.
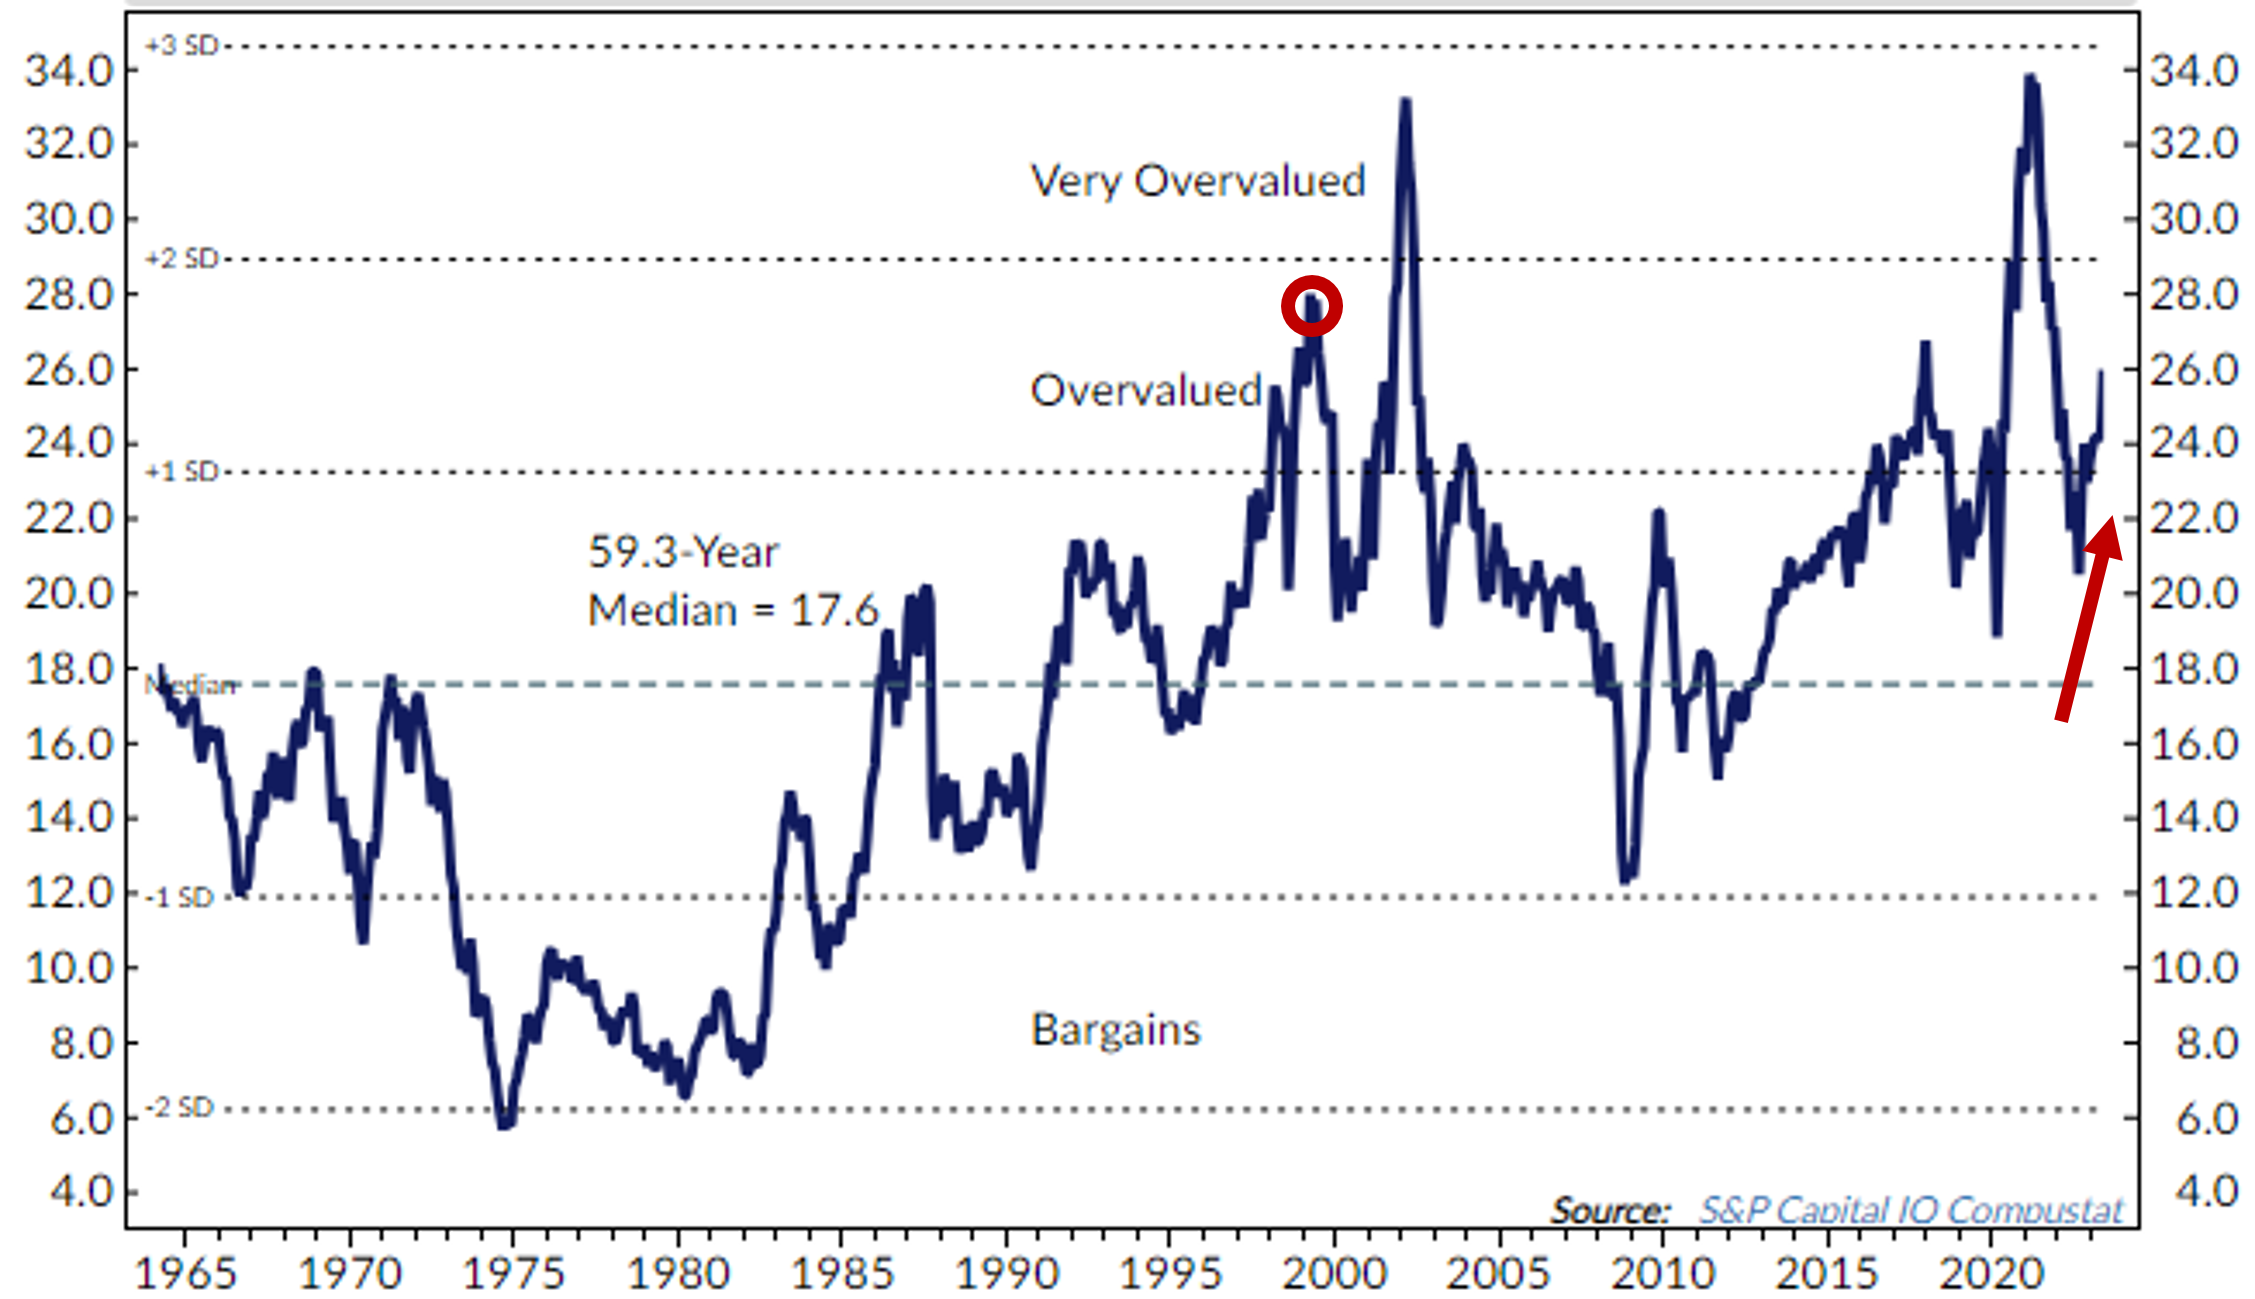 The current median P/E ratio for the S&P 500 is 26, approaching the level seen in the run-up to the bursting of the tech bubble in 2000. In the last sixty years, only two other periods have seen the P/E for the median stock in the index at higher levels than the late 1990s, which is the level we are approaching today. In the aftermath of 9/11 and during the COVID pandemic the P/E of the median stock in the S&P 500 rose above 30. In those two periods, the sharp increase in the median P/E was due to a temporary impairment of earnings in the short-term as spending cratered due to a curtailment of economic activity. Because the depression in earnings was temporary, the P/E ratio in that moment was not representative of the long-term trend in earnings, which created a buying opportunity for those investors who were confident markets and economic activity would recover. The earnings slowdown we are seeing today is not a temporary impairment due to an exogenous shock, but rather a function of the normal ebbs and flows of the business cycle. While it is possible that near-term earnings expectations are currently not reflective of the long-term trend due to the potential efficiency gains of artificial intelligence in the years ahead, that is by no means a certainty. The bottom line is that the market is currently not cheap, broadly speaking.
Against this backdrop, what might lie ahead in the back half of the year? A review of market history continues to provide positive news despite current valuation levels. In addition to the positive seasonality for the stock market in the year after midterm elections, which we discussed in our Q1 update, the strong start to the year U.S. stocks have experienced so far also bodes well for the rest of the year. Between 1925 and 2022 the S&P returned 10% or more in the first half of the year 28 times. In those 28 years, the return for the second half of the year was positive 75% of the time, with a mean return of 6.0% and a median return of 9.7%. Excluding 1929 and 1987, which each experienced sharp market crashes in October, other years with negative returns in the second half of the year saw declines in the low- to mid-single digits, leaving returns for the full calendar year firmly in positive territory. History is on investors’ side over the next six months – but market participants can’t be faulted if they keep a keen eye focused on market movements as we head into the fall.
U.S. Equity Markets
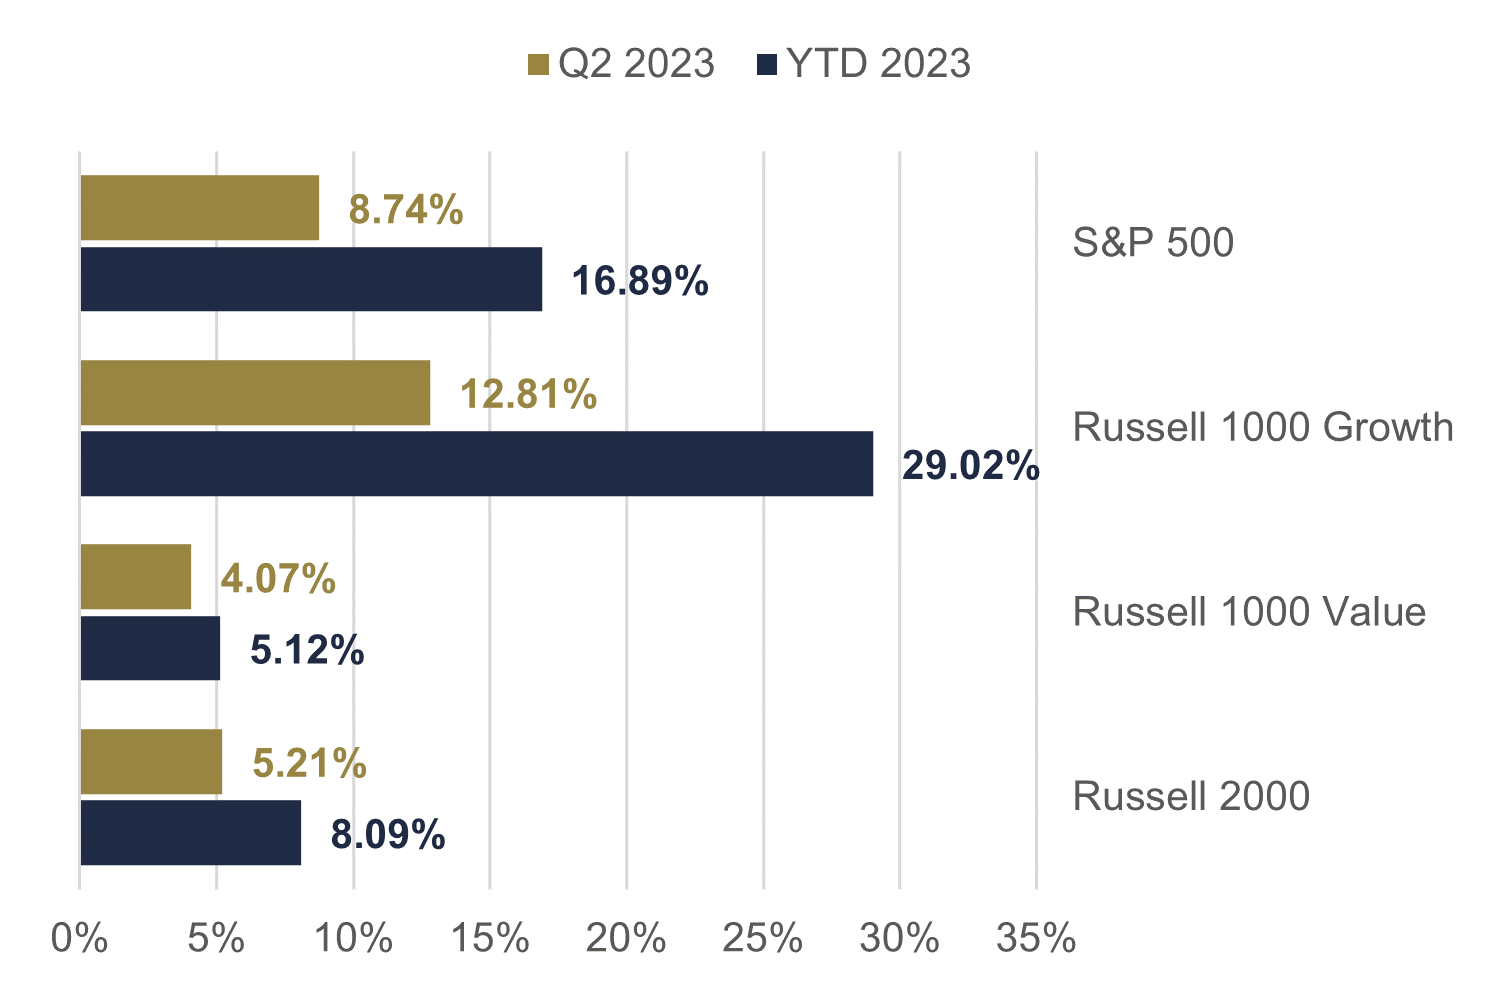 U.S. stocks delivered a first half for the record books in the first six months of 2023 but performance varied widely by style and sector. The S&P 500 finished the quarter up 8.74% and now stands up 16.89 year-to-date.3 Small-cap stocks didn’t participate quite so much in the party, again underperforming their large-cap peers, with the Russell 2000 Index up 5.21% for the quarter and 8.09% on the year. This pattern continues to break with historical trends, as small-cap stocks tend to outperform in positive market environments. As we discussed in our review of Q1 2023, the key driver of this divergence from the norm is the underlying sector and industry makeup of the two indices. The weight of the Financial Services sector in the Russell 2000 is 15.03%, compared to the sector’s 12.39% weight in the S&P 500. The Russell 2000 also includes the small- to medium-sized banks that saw significant share price declines in the aftermath of the SVB failure, while the S&P 500 Financials sector is dominated by Visa and Mastercard, payment processers not exposed to the same risks as banks, and a few large “too big to fail” banks that in many ways benefited from the turmoil in the regional banking sector. Another key distinction between the two indices is exposure to the Information Technology sector, which is the top performing sector year-to-date. Network effects provide a significant moat for today’s tech behemoths, created many “winner take all” markets. Smaller tech firms operate in a much more competitive environment. The Russell 2000’s exposure to the tech sector is only 13.68%, significantly lower than the sector’s 28.18% weight in the S&P 500.
U.S. equity performance varied widely by style during the second quarter as well. The Russell 1000 Growth Index, which is comprised of both large- and mid-cap firms, was up 12.81% for the quarter and 29.02% for the year through June vs. the 4.07% Q2 return and 5.12% year-to-date return of the Russell 1000 Value Index. The growth style led in small-cap as well – albeit by a narrower margin – with the Russell 2000 Growth Index returning 7.05% in Q2 and 13.55% year-to-date vs. the Russell 2000 Value Index’s return of 3.18% on the quarter and 2.50% on the year.
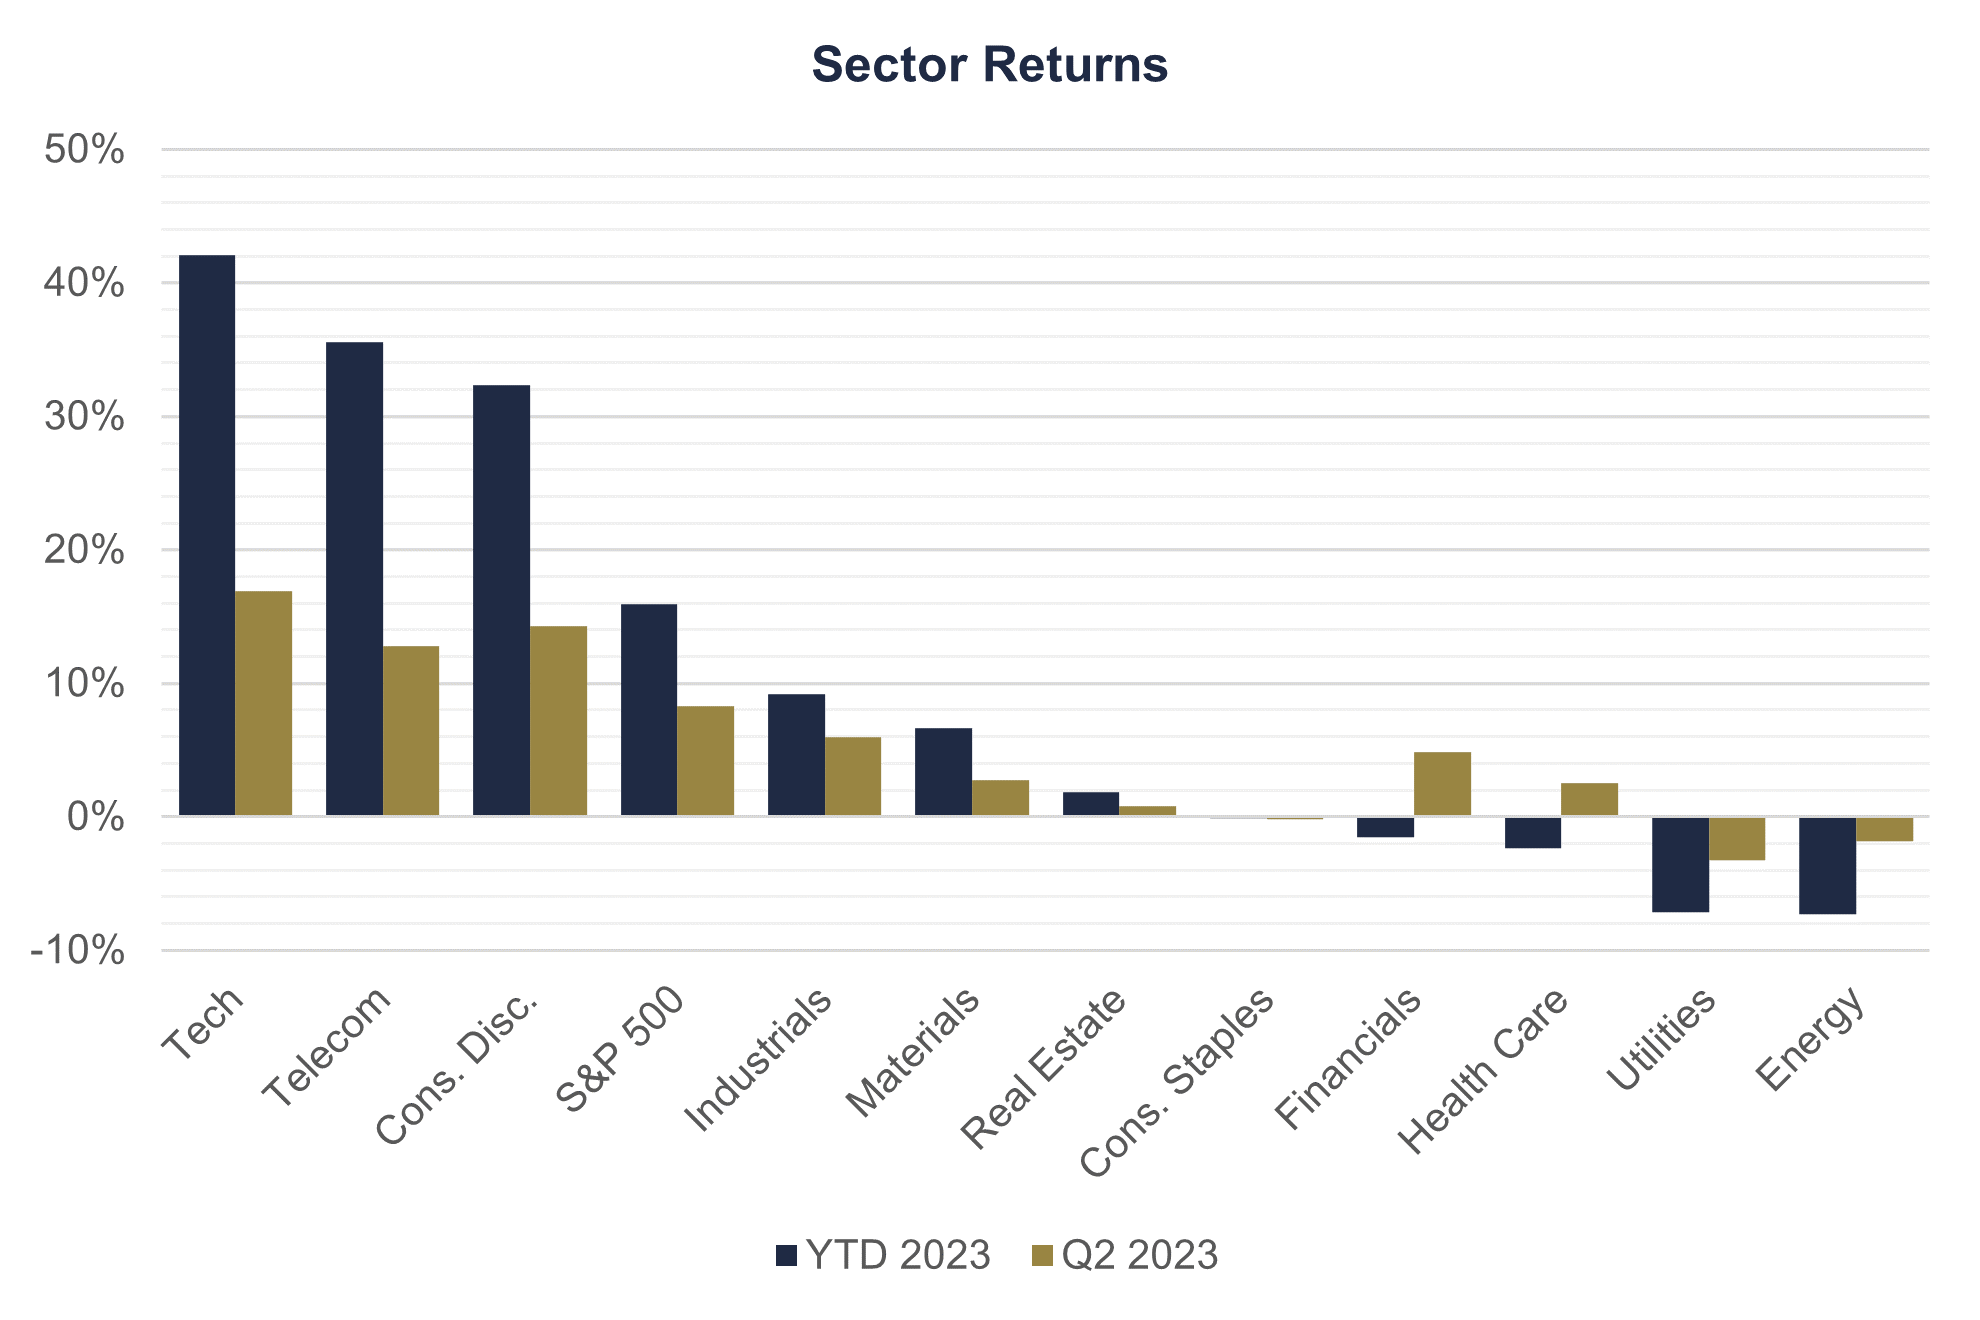 As to be expected when the divergence between growth and value is so wide, performance varied widely across sectors and industries in the first half of 2023 as well. Growth stocks continued to lead the market as excitement around the implications for artificial intelligence pushed stocks higher. Tech stocks were the best performers once again, gaining 16.93% in Q2 and 42.06% YTD. Telecommunications stocks weren’t far behind, returning 12.82% on the quarter and 35.58% on the year. This represents the best first half return for both sectors in history.4 Consumer Discretionary was the only other sector with a return greater than the S&P 500 Index overall for the quarter and year, gaining 14.31% on the quarter and 32.33% on the year so far, the second best first half return for the sector after 1975. Financial Services stocks recovered somewhat after the sector was the worst performer in Q1, up 4.83% in Q2, though the sector is still down -1.51% on the year. Energy stocks also continued to struggle in the second quarter after being the overwhelming leader in 2022, finishing June down another -1.79% for the quarter and now sits down -7.26% year-to-date.
International Equity Markets
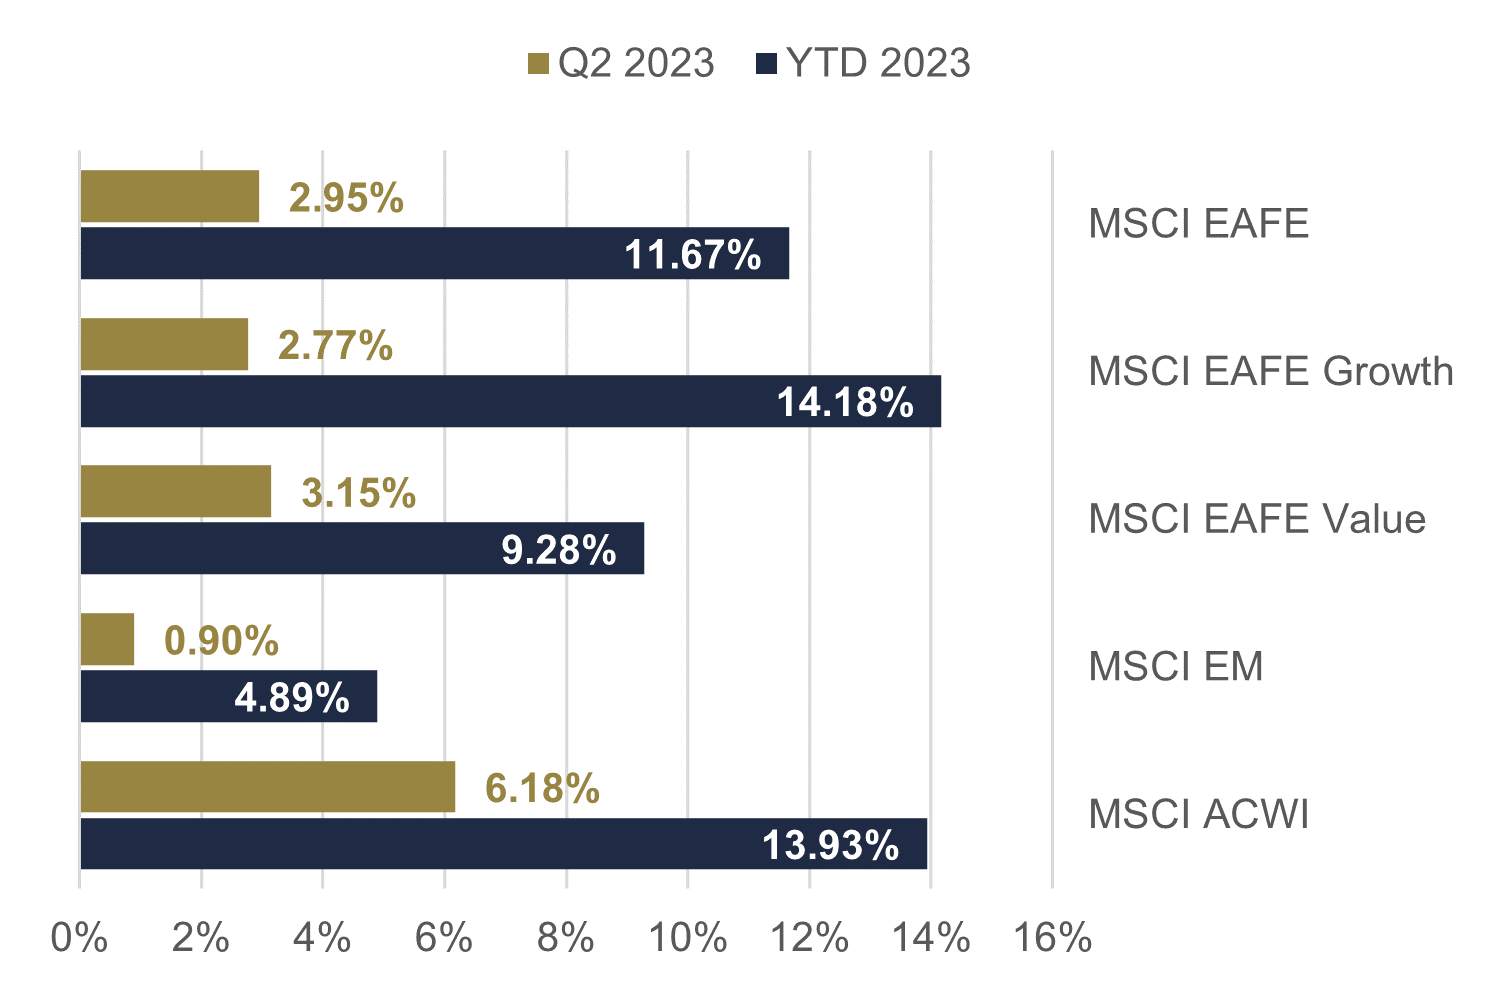 International equities have also performed well in 2023, though they now trail U.S. stocks on the year after a relatively weak Q2. The MSCI EAFE Index of major developed international equity markets was up 2.95% for the quarter and 11.67% for the year in U.S. dollar terms, trailing the S&P 500 by 5.79% in Q2 and 5.22% year-to-date. The growth/value trend was present internationally as well year-to-date, though the gap between the two styles was significantly narrower than in the U.S. after value slightly outperformed in Q2. The MSCI EAFE Growth Index gained 2.77% in Q2 and is now up 14.18% year-to-date vs. a gain of 3.15% on the quarter and 9.28% on the year for the MSCI EAFE Value Index. Japan has been the strongest performing country thus far in 2023, with the Nikkei 225 posting the second best first half in history in local currency terms, second only to 1989 when the index hit its all-time high. Europe faded slightly in Q2 after leading for the first three months of the year, with Ireland, Italy, the Netherlands, and Spain delivering solid double-digit performance. The countries with the largest weights in the regional index, Germany and France, merely treaded water in Q2. Asia ex. Japan was the weakest region both in Q2 and year-to-date. In emerging markets, concerns about economic growth in China saw stocks decline and dragged most of the rest of the index down with it, though Taiwan and South Korea represented bright spots. India rebounded in Q2 to finish as the top performer after being the biggest laggard in Q1. Summing up equity markets globally for the quarter, the MSCI ACWI Index, a proxy for the global stock market, finished Q2 2023 up 6.18% and is now up 13.93% year-to-date.
U.S. Fixed Income Markets
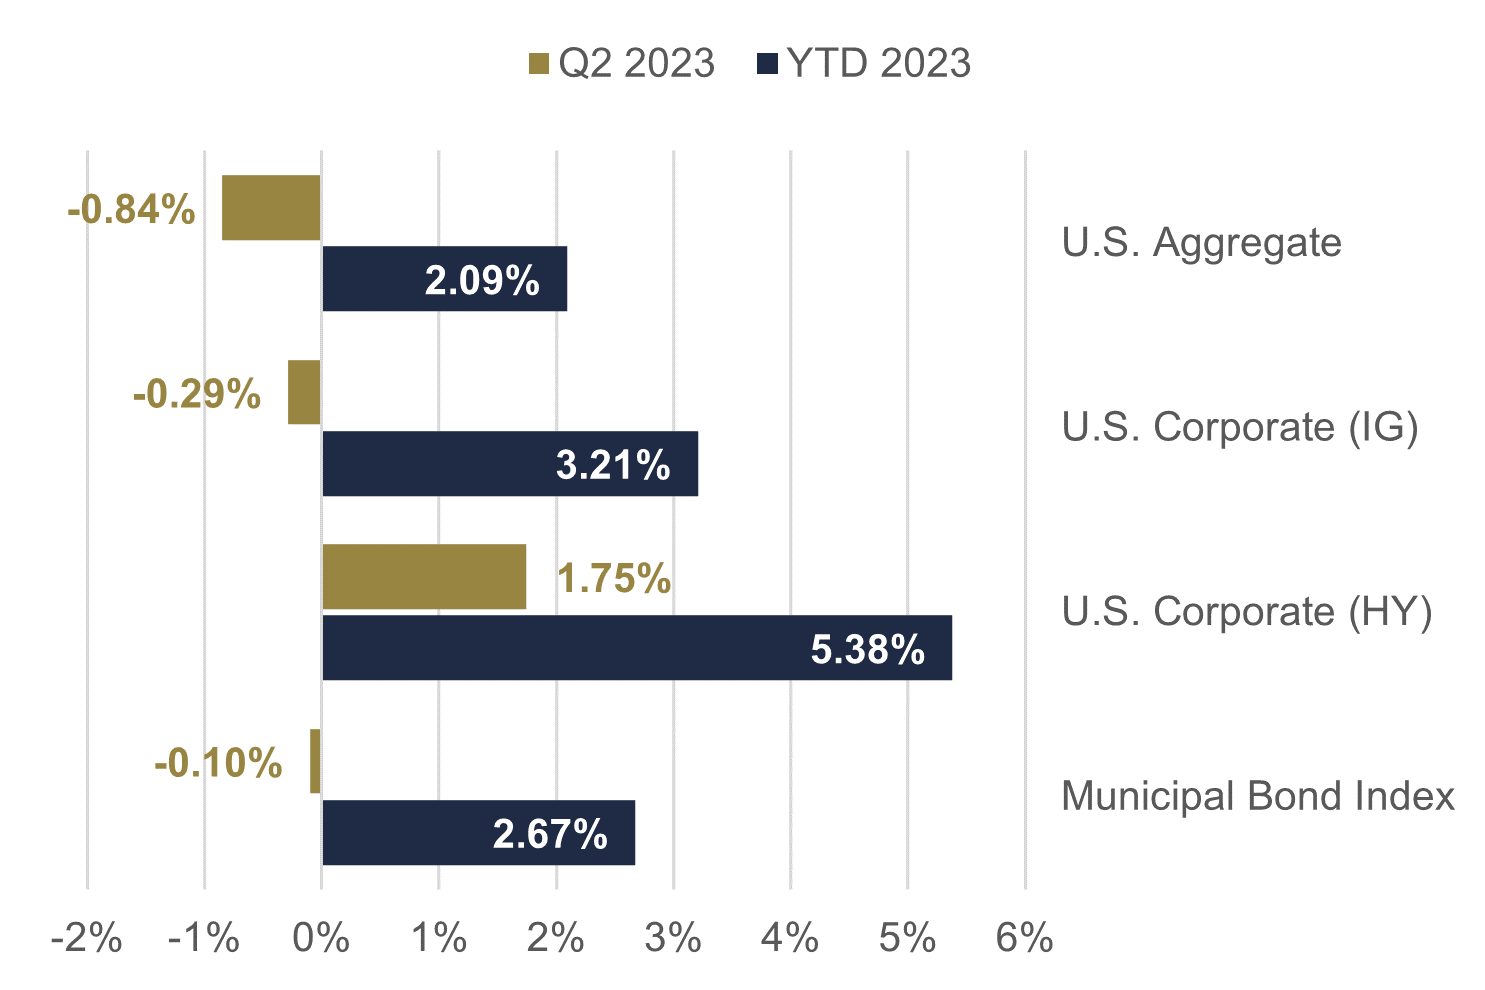 U.S. fixed income returns gave back some of the gains seen in Q1 as more hawkish rhetoric than expected from the Fed pushed up interest rates slightly, which in turn led to slight declines in most major indices for the quarter. The yield on the 10-year U.S. Treasury, which began the quarter at 3.47%, ended the second quarter at 3.84%, right around where it began the year. The yield on the 2-year U.S. Treasury experienced a larger increase, starting the quarter at 4.03% and finishing at 4.90%. The broad increase in rates across the various tenors of the yield curve when comparing yields at the start of the quarter to where they finished belies the true path of rates over the first half of 2023. Rates increased significantly on the front end of the curve, with the 1-year Treasury Bill now sitting at 5.39% after starting the year at 4.69%, falling at the end of Q1 in the aftermath of the SVB failure, and then rising again in Q2 as the damage in the banking sector proved relatively limited and the Fed continued to be more hawkish than market participants had originally believed. Despite the volatility, bonds with maturities at the longer tenors of the yield curve, which are more sensitive to rate changes, sit at the end of June around where they started the year, leaving all major areas of the fixed income market in the black for the first half of the year. The Bloomberg U.S. Aggregate Bond Index, a broad measure of the performance of investment-grade fixed income markets in the U.S., finished the quarter down -0.84% but remains positive on the year with a first half return of 2.09%. Investment-grade corporate bonds fared slightly better, giving back only -0.31% in Q2 to finish the quarter up 3.13% year-to-date. The riskier part of the corporate bond market rallied in Q2, finishing the quarter up 1.75% and is now up 5.38% on the year. Municipal bonds are now ahead of taxable investment-grade bonds for the year after trailing in Q1, with the Bloomberg Municipal Bond Index only falling 0.10% in Q2, leaving it up 2.67% on the year. Floating rate bonds, which have interest payments that adjust to the prevailing interest rate environment, have continued to shine. The Credit Suisse Leverage Loan Index gained 3.12% for Q2 and is now up 6.33% on the year. In short, an improving economic outlook was a positive for credit and a negative for interest rates in the first half of the year.
International Fixed Income Markets
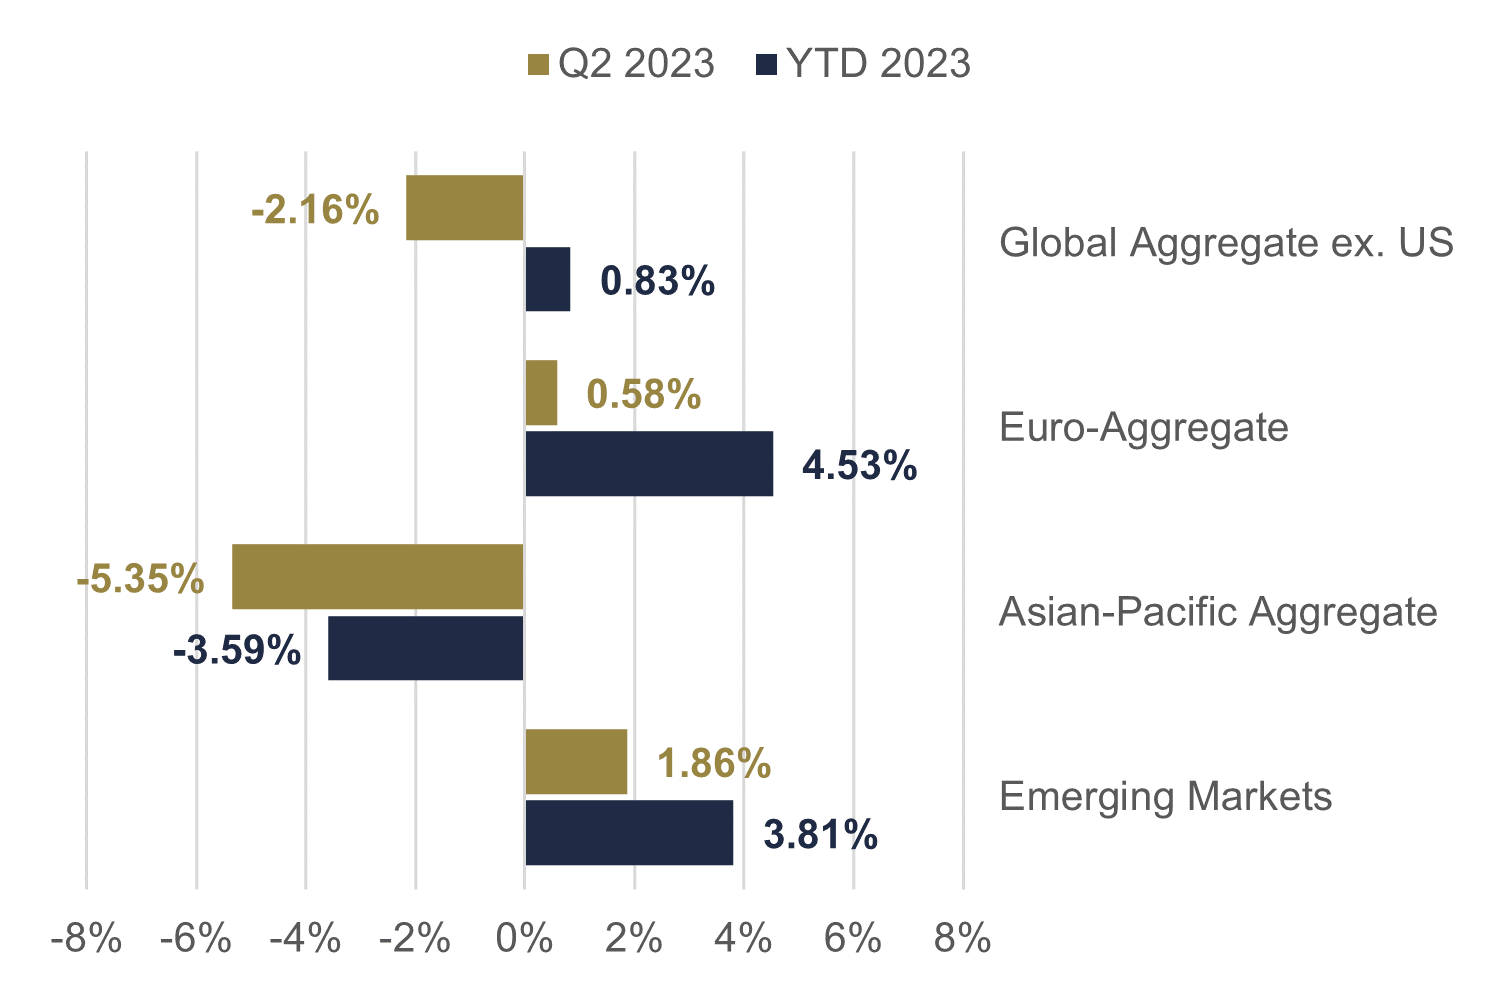 International fixed income performance significantly lagged the U.S. on the quarter as monetary policy stances are beginning to diverge. The Bloomberg Global Aggregate ex. U.S. Bond Index, a proxy for the global investment-grade credit universe outside of the United States, finished Q2 down -2.16% and is now up only 0.83% on the year. Regionally Asia-Pacific underperformed, losing -5.35% on the quarter, and now sits down -3.59% year-to-date. Europe managed to stay in the black for Q2, finishing June up 0.58% over the previous three months and up 4.53% year-to-date. Emerging market bonds, which are predominantly issued in U.S. dollars, had a relatively strong quarter after lagging in Q1. The JPMorgan Global Core Emerging Market Bond Index returned 1.86% on the quarter and is now up 3.81% for the year. Summing up fixed income markets globally for the quarter, the Bloomberg Global Aggregate Bond Index, a proxy for the global bond market, finished Q2 2023 down -1.53% for the quarter, leaving the index up 1.43% year-to-date.
Solid First Half, but Caution Still Warranted
After historically poor cross-asset performance in 2022, rallies in nearly all major asset classes were a welcome relief for investors in the first half of 2023. While history would suggest that the equity market may continue to rally from here, we believe that a modest reduction in the level of uncertainty in the current macroeconomic environment may be producing an overreaction to good news, resulting in stretched valuation levels. In light of current valuation levels, a cautious approach remains prudent. The stocks and bonds of high-quality companies with strong balance sheets will perform well relative to those of lower quality companies should economic and market conditions deteriorate and also deliver solid risk-adjusted returns in a more risk-on market environment. The key is developing a plan and executing on it consistently, whether that involves putting excess cash to work or rebalancing fully invested portfolios.
We remain committed to focusing on your long-term financial goals and priorities by constructing portfolios designed to reach those goals while minimizing risk. As always, our clients’ interests always come first, and our goal is to continue to separate the signal from the noise and focus on what truly matters in the economy and markets to help you achieve your investment goals. Should you wish to have a more in-depth conversation about the current environment and its impact on your portfolio and long-term financial plan, please reach out to your Fulton team.